Global Sales & Profit
Overview Dashboard
This dashboard provides a comprehensive overview of global sales, profit, and shipping performance across different categories, segments, and markets. It highlights key insights such as top-performing regions, most profitable product categories, and shipping cost trends.
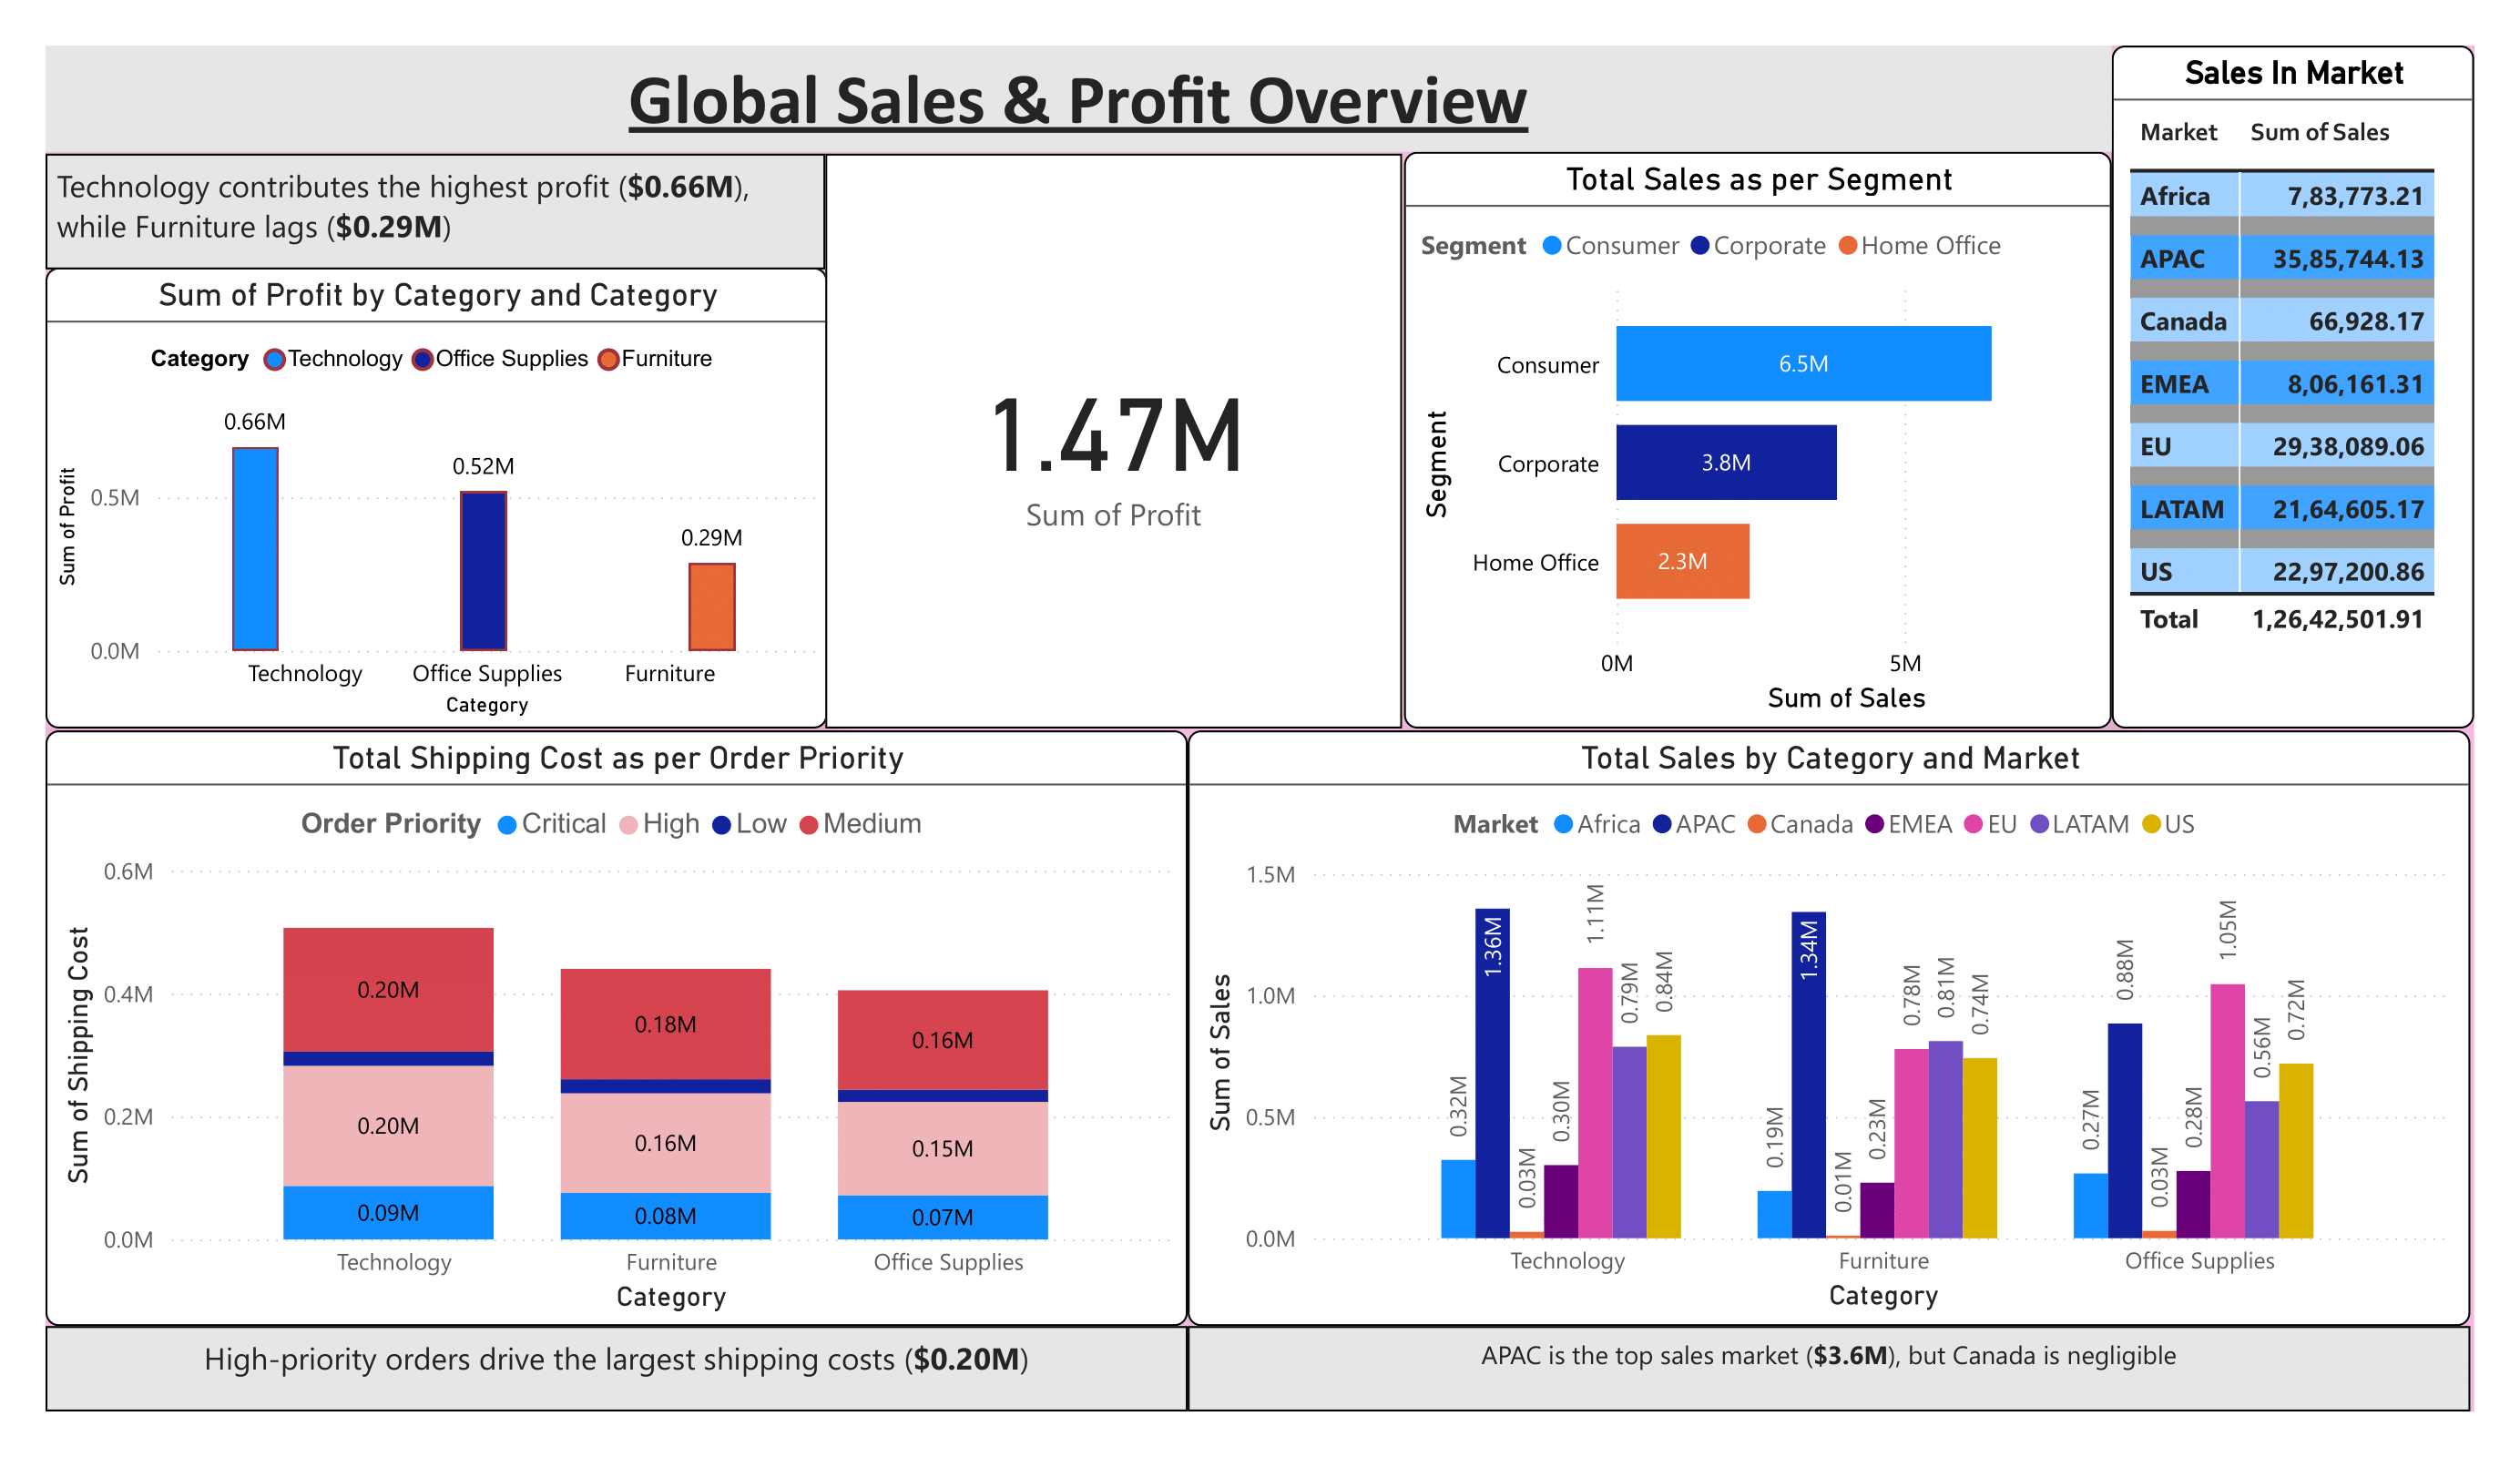
The dashboard reveals that Technology contributes the highest profit ($0.66M), followed by Office Supplies ($0.52M), while Furniture lags behind with $0.29M. The total profit across all categories amounts to $1.47M.
In terms of market performance, the APAC region leads with the highest sales of $3.6M, whereas Canada shows negligible contribution. Among customer segments, the Consumer segment generates the largest sales volume ($6.5M), followed by Corporate ($3.8M) and Home Office ($2.3M).
The dashboard also highlights that high-priority orders drive the largest shipping costs ($0.20M). Overall, this report provides actionable insights for improving profitability, optimizing logistics, and identifying key markets for strategic growth.